Quality of Life and Internet Access
By Biddy Bi, Sam Iacavazzi, Shirley Liu, and Natalie Schmit
This contains a summary of the Final Project for DS 201. For more in-depth in-sight, please check out our walkthrough video or run our notebook directly in Google Colab linked below.
- Introduction
- Data Organization
- Exploratory Data Analysis
- Conclusions
- More Information
- Acknowledgements
Introduction
As data science students, we place much of our faith in the ability of technology to shape a more knowledgeable, ethical, and prosperous world. In the past decade, most countries were faced with an increasing number of Internet users. With easier access, the Internet has become an integral part of our lives. However, many communities around the world lack access to computers and the internet. The San Diego Foundation of September 19, 2020 defines the digital divide as threefold: an economic divide, a usability divide, and an empowerment divide. The digital divide doesn’t just describe an inequity in basic access to technology; in our rapidly developing world, it also encompasses the technical and financial ability to make full use of available technology, taking into consideration access (or lack of access) to the internet.
According to the Office of Policy Development & Research of 2016, lack of high-speed internet access can negatively impact economic growth, household income, educational performance, healthcare access, and employment searches. It is clear that internet access plays a big role in one’s well being.
However, there are opposite voices with the growing number of researches on Internet addiction saying that Internet usage caused psychosocial disorder. They claim that internet usage creates a heightened level of psychological arousal, resulting in little sleep, failure to eat for long periods, and limited physical activity, possibly leading to the user experiencing physical and mental health problems such as depression, OCD, low family relationships and anxiety. People don’t need a disorder to feel the negative impacts of the internet; even internal research within Facebook found that Instagram use negatively impacted teen girls’ body image. Additionally, the increasing amounts of misinformation circulated on globalizing social media platforms create echo chambers that, in the long run, may negatively impact not only an individual but also greater society around them.
So, we decided to analyze data about internet access and various wellness aspects in a number of countries to answer the following question: How does access to the internet affect a country’s overall quality of life/ happiness? We want to see whether internet plays a positive impact more to people’s life or negative impact is more dominant.
Although many studies have been conducted regarding the rural-urban digital divide in the United States, we are interested in the global impact of internet access. This analysis could help us identify whether it is worth investing in infrastructure that will provide high-speed internet access across the world, or if the presence of the internet is more detrimental than helpful.
Data Organization
In order to obtain insight on our question of how access to the internet affects a country’s quality of life, we used two main datasets. The first dataset, World Happiness Report, is a survey of the state of global happiness publiced by the Sustainable Development Solutions Network. The Report is written by a group of independent experts acting in their personal capacities. Any views expressed in this report do not necessarily reflect the views of any organization, agency or program of the United Nations. This particular dataset compiles data from 2005 to 2020, although not every country has values for every year. Each country’s happiness score is based on answers to the Gallup World Poll. The dataset also calculates the extent to which six factors (GDP, social support, life expectancy, freedom to make life choices, generosity, and perception of corruption) contribute to a country’s happiness score.
The latter dataset, which is from the International Telecommunication Union (ITU), describes the percentage of population in a given country who are using the internet. This dataset spans from 2000 to 2019, but, as with the former dataset, some countries do not have values for certain years. ITU is a UN specialized agency for global ICT (Information Communication Technology) statistics. These percentages were provided by internet providers in the specific countries. We will use these two datasets to investigate the impact that internet access has on various metrics of well-being.
After filtering the data by removing the irrelevant attributes to our analysis, we ended up with the following attributes:
World Happiness Project Data
| Attribute | Data Type | Description | Nullable |
|---|---|---|---|
| Country name | Nominal | Indicates country this data is collected from | No |
| Year | Interval | Indicates year this data is collected from | No |
| Life Ladder | Ordinal | Overall Happiness Score (Variable name Life Ladder). National average response to life evaluation question: Please imagine a ladder with steps numbered from 0 at the bottom to 10 at the top. The top of the ladder represents the best possible life for you and the bottom represents the worst possible life for you. On which step of the ladder would you say you personally feel you stand at this time? | No |
| Log GDP per capita | Ratio | Measures the total monetary value of all final goods and services produced throughout a year per person per country. Logarithmic GDP per capita means every step up the y-axis is an identical percent change in real GDP per capita. Log GDP per capita is an indicator of economic growth. | Yes |
| Social Support | Ordinal | Having someone to count on in times of trouble (Social Support) is the national average of binary (0-1) responses to the question: If you were in trouble, do you have relatives or friends you can count on to help you whenever you need them, or not? | Yes |
| Healthy life expectancy at birth | Ratio | Indicates life expectancy. This number is extracted from WHO data. | Yes |
| Freedom to make life choices | Ordinal | National average of binary responses to the question: Are you satisfied or dissatisfied with your freedom to choose what to do with your life? | Yes |
| Generosity | Ordinal | Residual regression of national average in response to the following question on GDP per capita: Have you donated money to a charity in the past month? | Yes |
| Perceptions of Corruption | Ordinal | National average of survey responses to two binary questions: Is corruption widespread throughout the government or not? Is corruption widespread throughout businesses or not. | Yes |
| Positive Affect | Ordinal | National average of three positive affect measures: happiness, laugh, and enjoyment. Based on the following questions: Did you experience the following feelings during a lot of the day yesterday? How about happiness? Did you smile or laugh? How about enjoyment? | Yes |
| Negative Affect | Ordinal | National average of three negative affect measures: worry, sadness, anger. Questions: Did you experience the following feelings during a lot of the day yesterday? How about sadness? How about worry? How about anger? | Yes |
Definitions acquired from the Statistical Appendix from the World Happiness Report.
ITU Internet Access Data
| Attribute | Data Type | Description | Nullable |
|---|---|---|---|
| Country | Nominal | Indicates country this data is collected from | No |
| Years (2000-2019) | Interval | Indicators year this data is collected from | No |
| Values under years | Ratio | Percent of individuals using the internet in a given country in a given year | Yes |
Exploratory Data Analysis
Here we explore some of the most interesting trends in our data. Please refer to our notebook to explore the findings in greater depth.
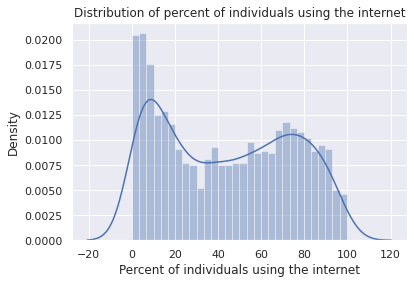
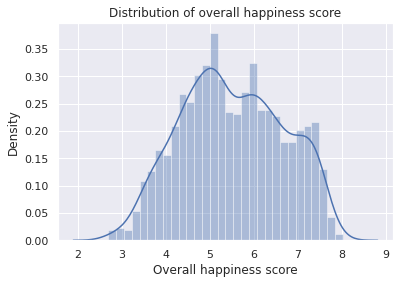
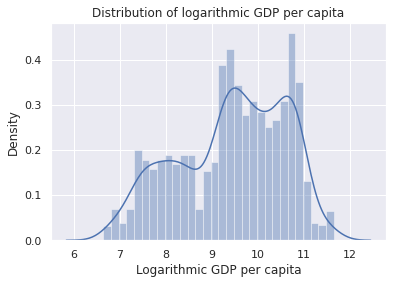
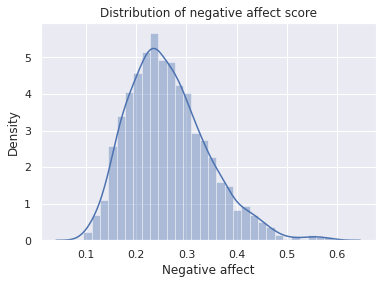
Distribution of Variables
The following plots show the general distribution of Internet Access, Overall Happiness, Logarithmic GDP per Capita, and Negative Effect. These general distributions allow us to gain greater insight into the data set.
Variable Correlations
There are many different variables in this dataset and some may have unexpected relationships. The first order of business is to visualize the relationships between all variables in order to see if any of these unexpected relationships exist. We plot the correlation map below to see the correlation between each attribute. The lightest color show a strong positive correlation and the darkest color show a strong negative correlation. We chose to include 2009, 2014, and 2019 to give a wide range of years here. More details and charts are shown in our colab markdown.
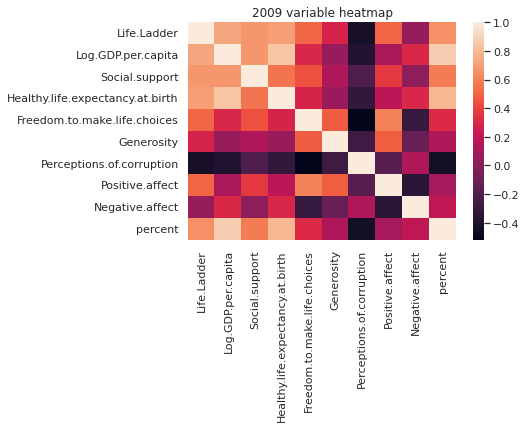
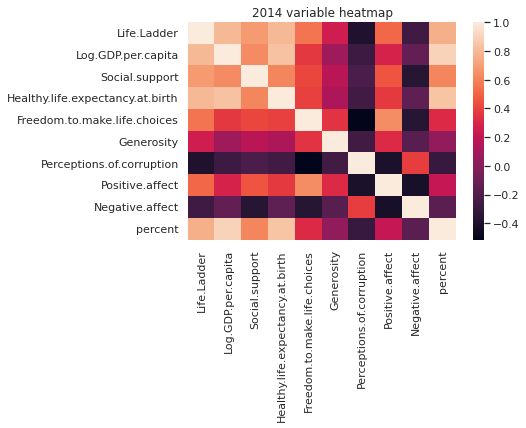
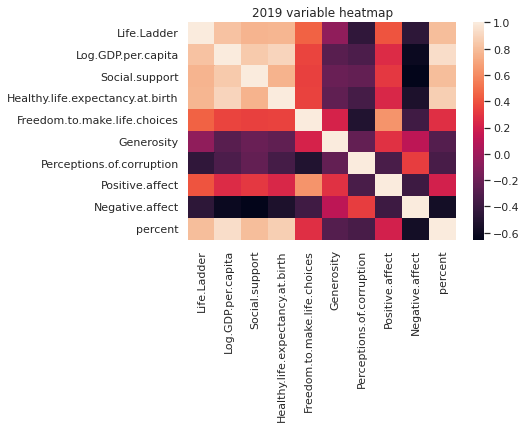
One of the biggest correlations seems to be between percent of internet users and GDP. This is expected, as internet access can be expensive since it requires both a computer and a great deal of infrastructure. Life Ladder, Healthy life expectancy, and social support also seem to have strong correlation with percent. There’s an interesting pattern that Life Ladder and social support seem to be more and more positively correlated to internet percent and gdp and healthy life expectancy are strongly correlated to internet access percent all the time. There’s another interesting pattern here that the internet accessibility “percent” varaible has stronger negative correlation with the negative affect and stronger positive correlation with the positive affect over the year. However, overall the positive correlation between positive affect and percent is weaker than the negative correlation between negative affect and correlation. Interestingly the plot in earlier years show a strong negative correlation between internet use and perceptions of corruption, however the strength of this correlation seems to diminish over the year.
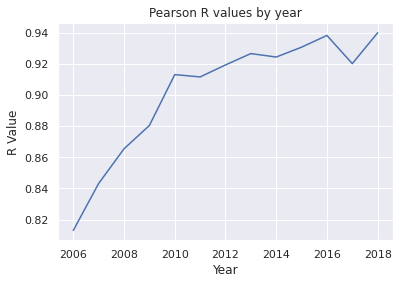
We test all the correlation mentioned above with statistical test. The null hypothesis is that there is no correlation between these variables pairs we mentioned above. Then we take a look at the p value and filter out all the correlated pairs that reject the null hypothesis. In the following section, we take a look at the main variables correlation that we are interested to answer the problem we have and is statistically significant. We take a look at the r value provided by the pearson correlation test. The value shows the direction of the correlation and the strength of the correlation.
GDP and Internet Access Comparison
As GDP and Internet Access are so closely correlated, we chose to analyze this relationship further.
It seems that GDP and Internet Access have a very strong positive correlation. This relationship is a bit weaker in the earlier years, however it remains apparent that these are connected. Additionally, this relationship initially starts out looking like exponential growth that shifts to being linear over time.
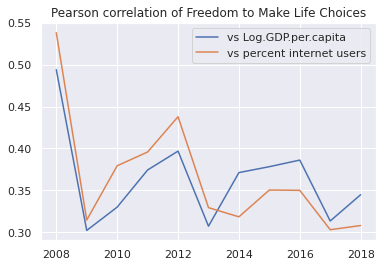
These results left us questioning whether GDP or Internet Access was the true driver for these outcomes. We chose to analyze the Pearson Correlation for GDP and Internet Access with Freedom to Make Life Choices to answer this question. We concluded that Internet Access and GDP are inextricable because each is more strongly correlated with things such as Freedom to Make Life Choices at different points in time. Ultimately, Internet Access and GDP further the other, and subsequently general happiness.
Then, we found the Pearson correlation for negative effect and life ladder with Internet Access. We found that Internet Access is inversely correlated with Negative Effect. We chose to analyze Negative Effect as it separates feelings of happiness from general life satisfaction, which is the focus of the life ladder. The second graph proves that Internet Access improves happiness and life satisfaction.
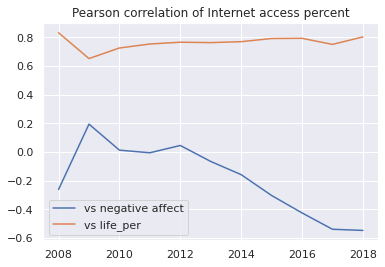
The great depression in 2008 seems to affect some of our variables. However, the test does show us some insights. We can see from the r value plot above that life ladder have a very strong correlation with internet percent since the r value is around 0.8. The negative affect and internet percent r value is having stronger correlation over time but the absolute value of r for negative affect with percent is still smaller than life ladder with percent. Therefore, we conclude that the internet accessibility has stronger positive correlation with people’s satisfaction of life(life ladder index) than the negative correlation with bad feelings(negative affect variable.) We then move on to visualize internet accessibility with life ladder.
World Map Data
Our goal is to see whether there are some interesting patterns in changes in internet accessibility over time in different parts of the world. Same for the overall happiness index—Life Ladder. We also want to see what are some interesting patterns when comparing these two attributes together overtime. We hypothesize that internet access and overall happiness are correlated
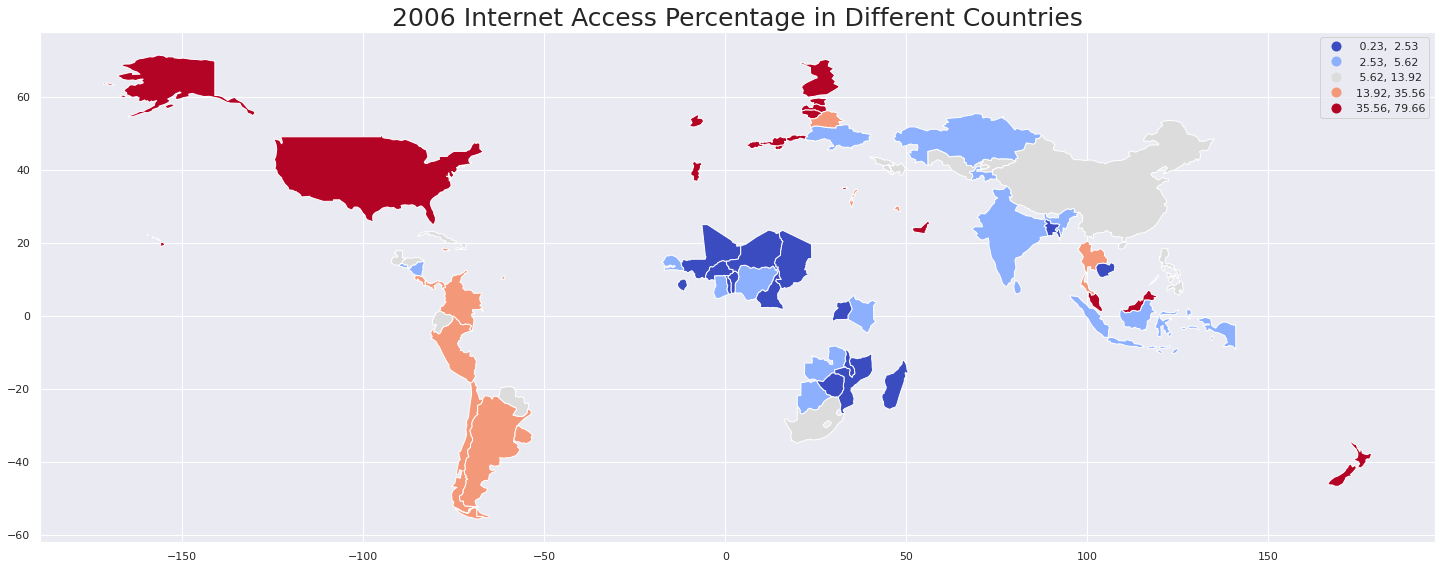
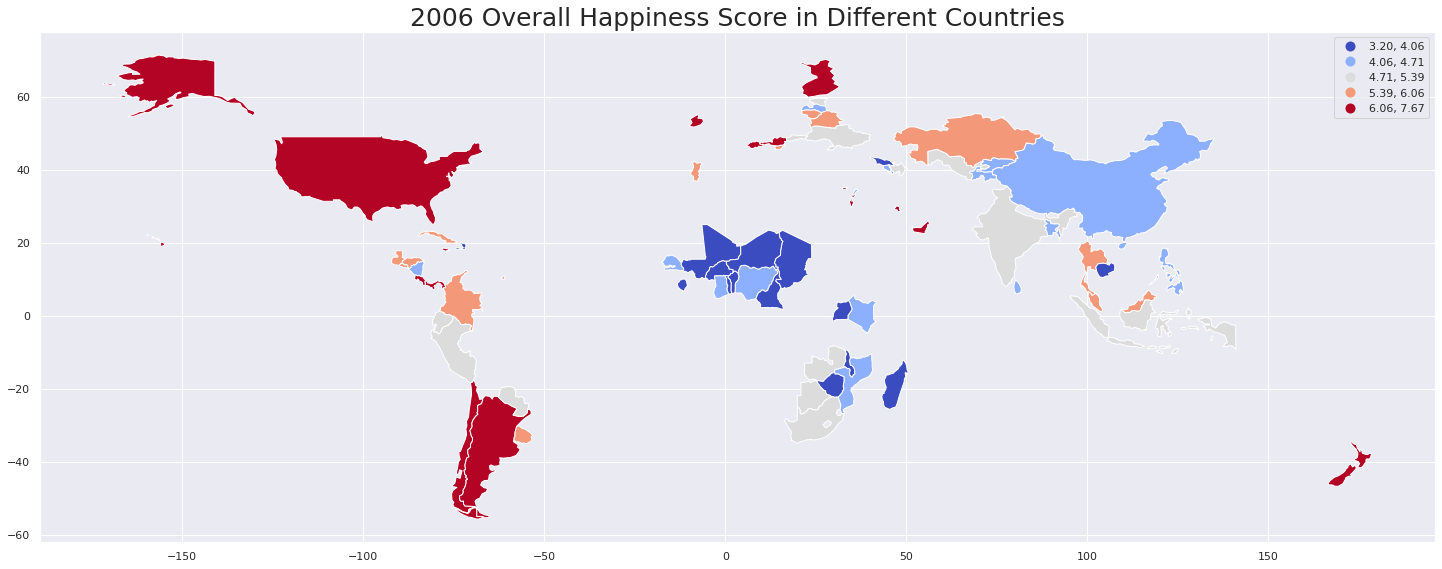
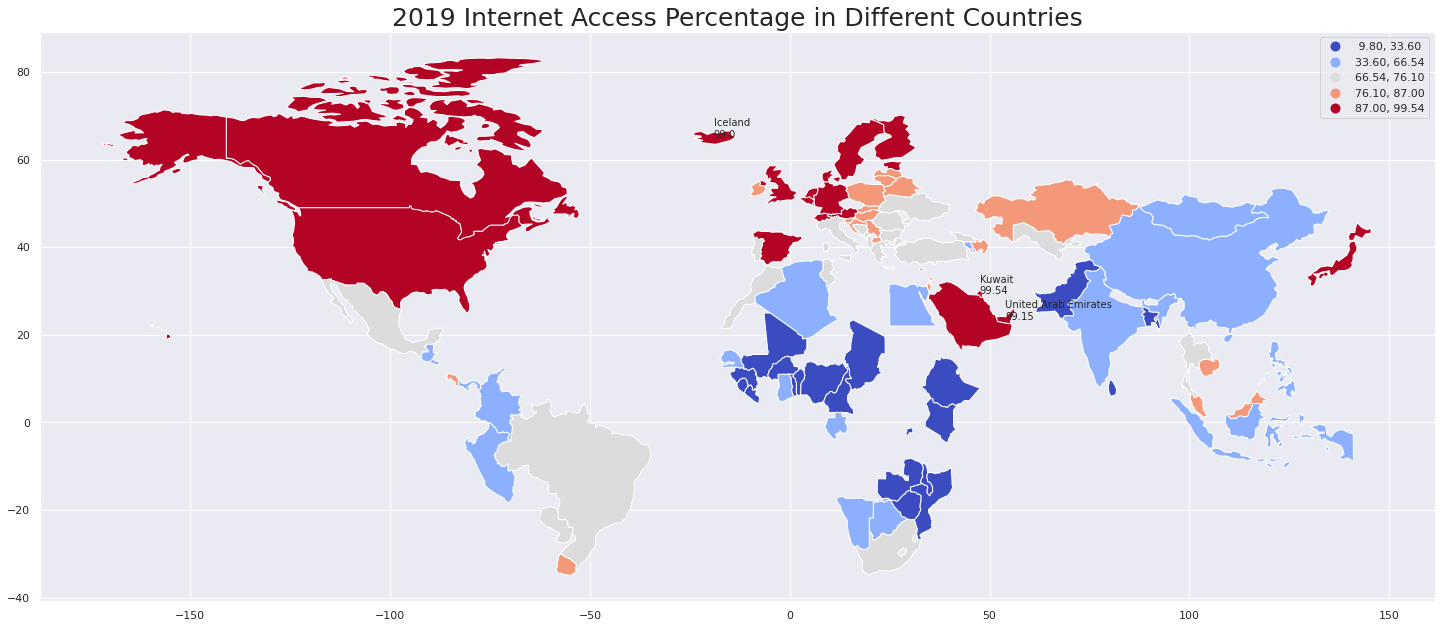
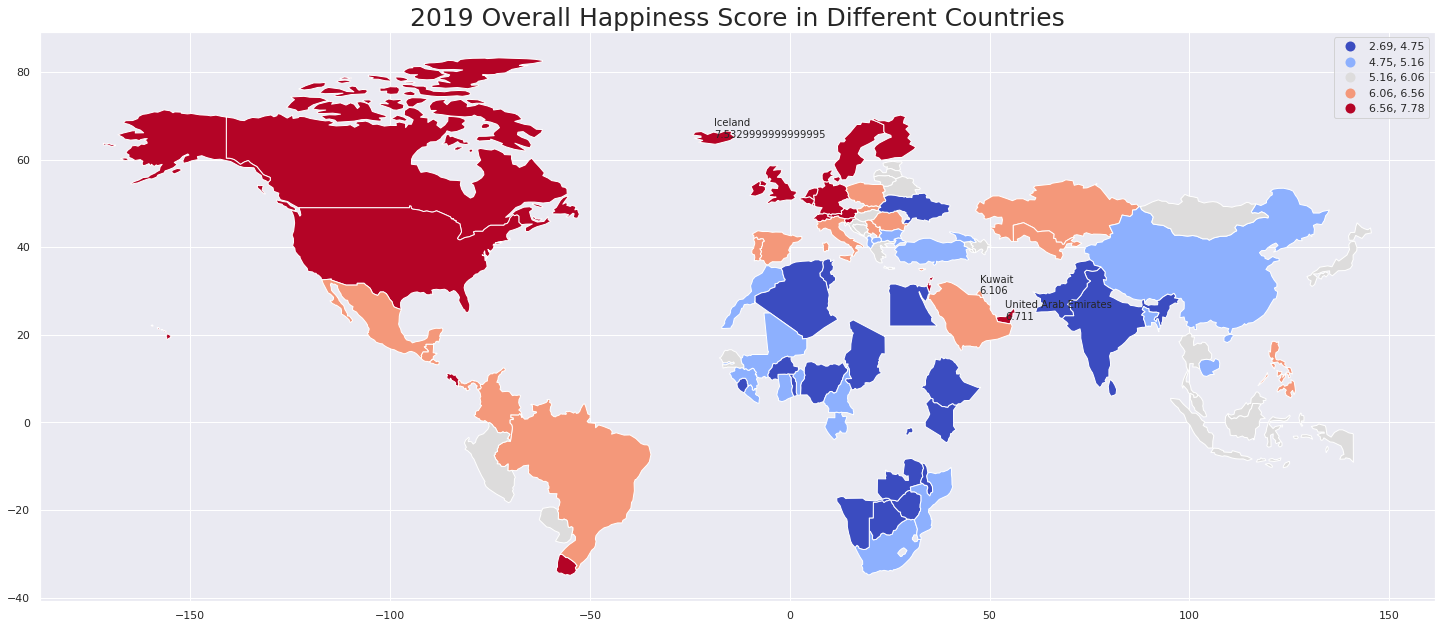
Overall, these graphs support our above hypothesis. Many countries with high percentage of internet access also have high overall happiness scores. For example, Australia has high internet access and high happiness from 2010 onward. Meanwhile, other countries show consistently low internet access and low happiness such as India. Despite these results, these graphs lack a clear explanation of change over time in a single country which we will do more clearly in the following graphs.
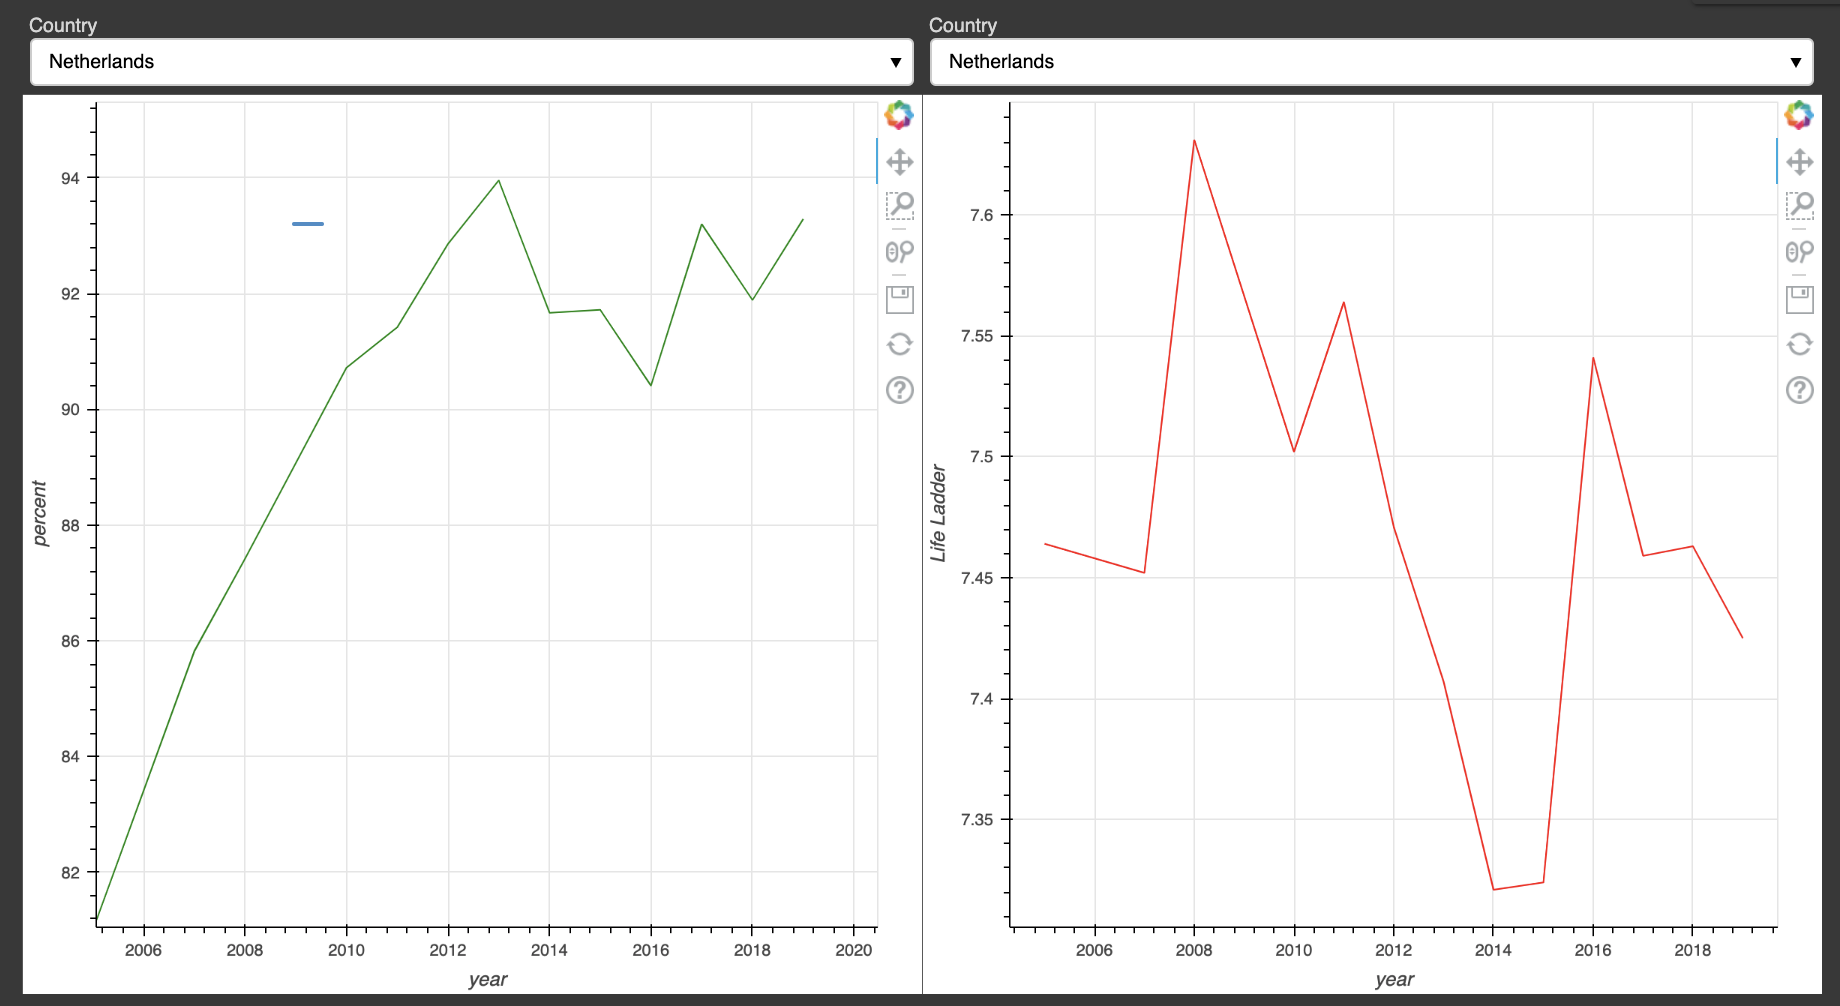
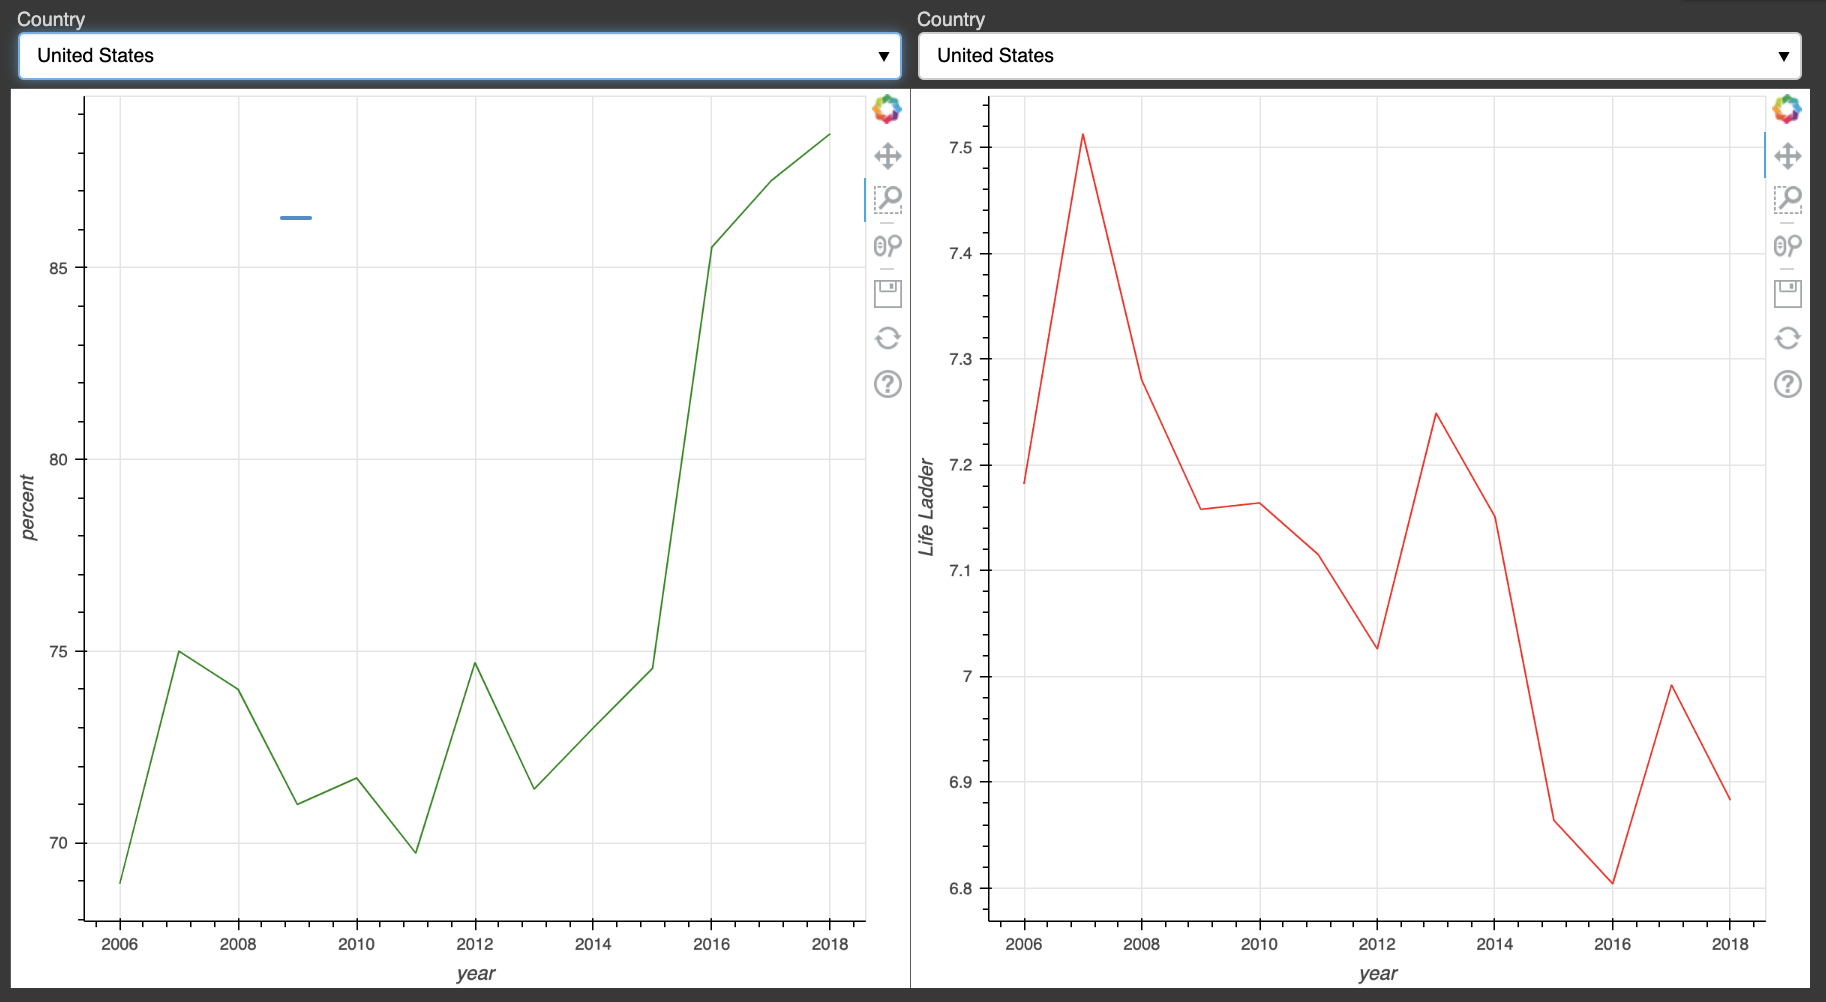
Happiness and Internet Access Comparison
The overall trend for most countries’s internet accessibility was increasing over time. Countries like Netherlands, Canada, UK, New Zealand, etc. have high internet accessibility throughout the entire time period. These countries also have consistantly high happiness scores. Meanwhile, countries like Saudi Arabia, Kazakhstan have rapidly increasing internet access from the low percentile to the high percentile. Furthermore, the happiness index, is way more volatile than internet index.
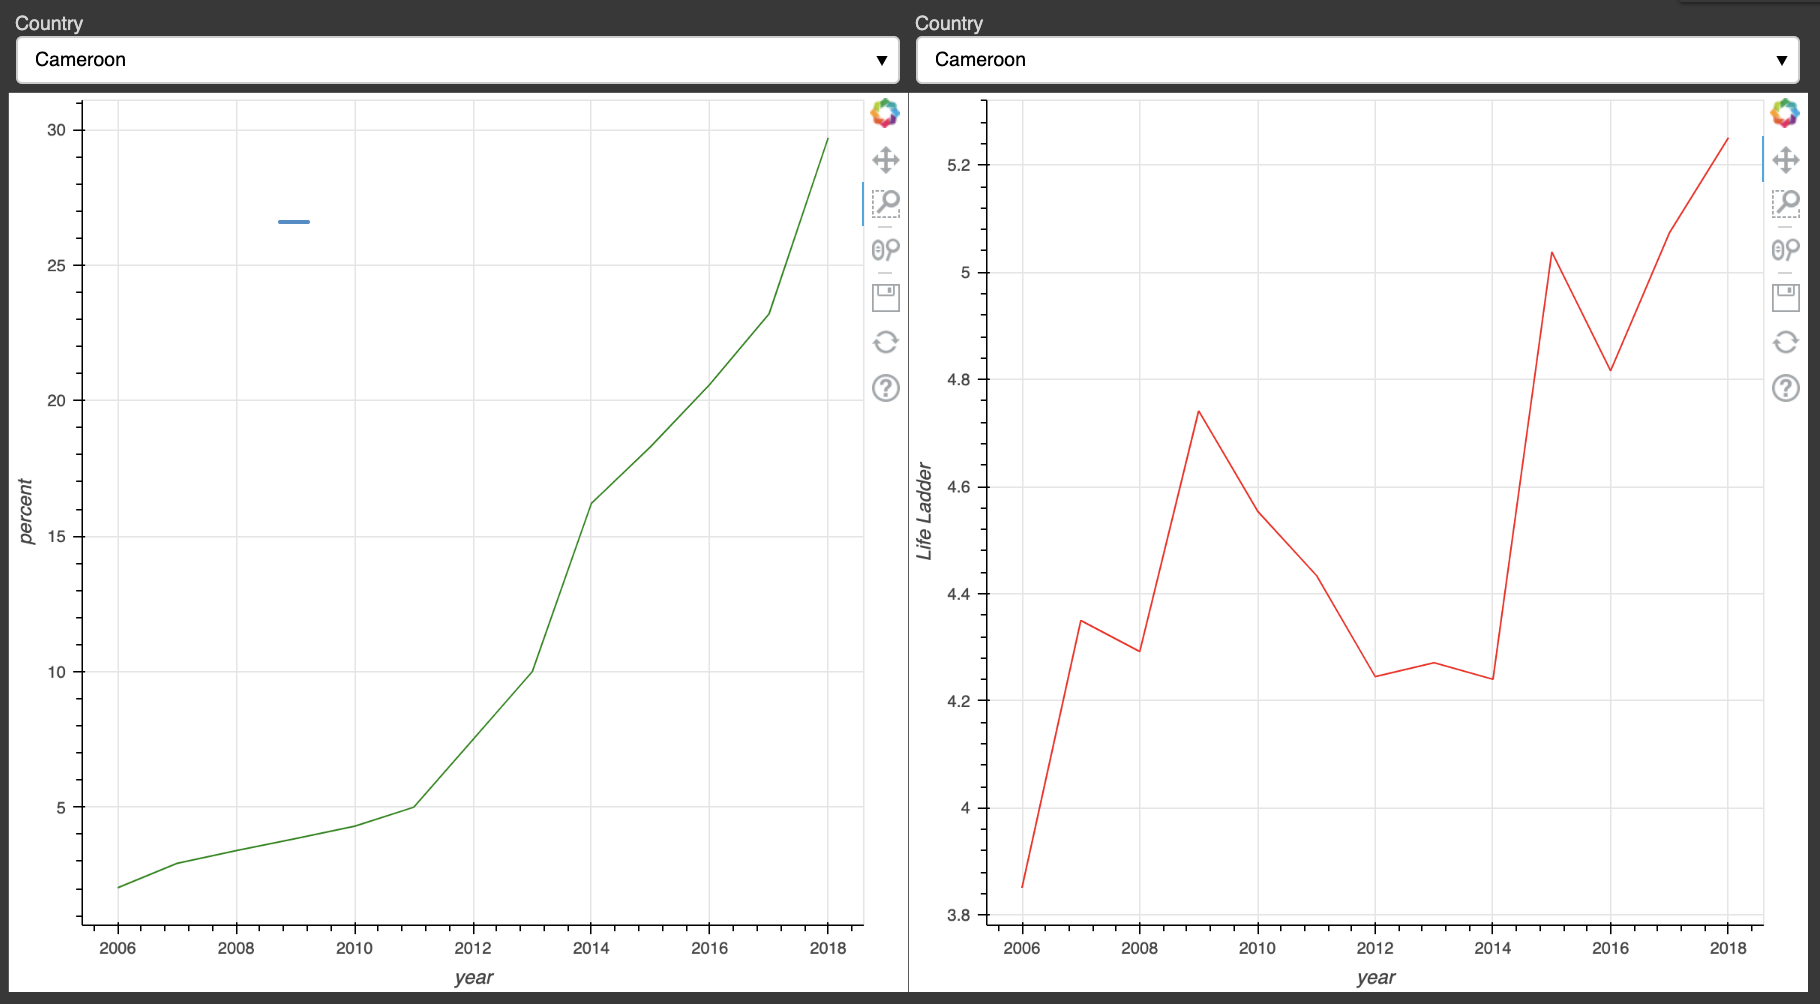
It seems that for countries whose internet accessibility climbs up to near 90 percent, the happiness index has a upward trend. This is especially true for internet accessibility that goes up from an extreme low value, there’s a upward trend in happiness index(For example, Cameroon).
However, for internet accessibility that’s high the whole time, the happiness index tends to be volatile. For example, around 65% of Americans had access to the internet in 2006 and by 2018 that number is over 90%. Yet, the happiness score for the United States trendsdownwards for that same time period.
Confusion Matrix
In the following section, our group decide to do a SoftMax Regression model on internet access to further confirm all the relation we state above. To do so, we need to first create another column since the internet percent attribute is continuous instead of a categorical data. We will classify the column percent into three groups based on percentile. In the column, number that>71 will be considered as high internet connectivity, between 15 and 71 is neutral internet , and number<15 will be considered as low connectivity. We make this division based on 25 percentile and 75 percentile of the data. Also we can see from the distribution plot at the data preparation section that the density is way higher under value 15 and the density is relativly low between 15 and 71.
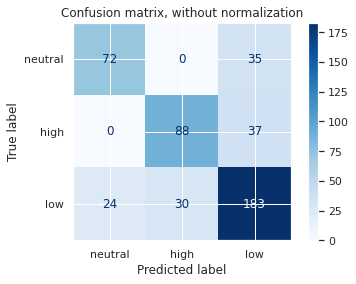
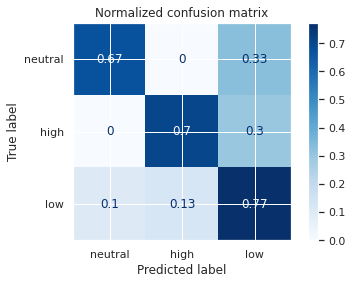
The accuracy is 73% which is not bad. We can see from the confusion matrix that most of the data falls in the main diagonal from the top left corner to the bottom right corner of the square matrix. This shows that model performs well and there’s not many Type I and Type II error.
Conclusions
The goal of our analysis was to analyze how internet access affects a country’s overall well-being. We explored data on various aspects relating to the happiness of different countries, as well as the percentage of the population who has internet access in these countries. Based on our analysis we make the following conclusions: internet access does have strong positive correlation with overall quality of people’s life and people’s overall feeling on happiness. However, there’s also a moderate negative correlation between negative affection and internet access. The correlation is not as strong as the life ladder correlation. We argue that internet access has more effect on the overall happiness of people (this includes not only the feeling of being happy but more about how satisfy people are with their lives) than the negative feeling ( feeling sad, worry, or angry).
Main Observations
Firstly, we observed strong correlations between the percent of people with internet access and life ladder (overall happiness), log GDP, life expectancy, and social support. Those trends stayed consistent across countries from 2008 to 2019. Internet access and GDP seem to be the primary drivers of the strong positive correlation as they have high Pearson correlation statistics.
Overall, most countries experienced an increase in general happiness, internet access, and other positive covariates throughout the time span. Many countries with consistent internet use, also had consistently high happiness scores, such as Australia. To take this one step further, we observed certain trends based on access to the internet. For countries with lower GDP and subsequently less infrastructure, increasing internet access makes a huge difference in happiness. For countries with high internet access already, increasing access doesn’t have a significant effect on overall happiness.
Future Directions
Based on our insights, we can make the following recommendations to clients interested in increasing global happiness generally, and through internet access.
Philanthropic organizations interested in making a difference should focus on distributing funds, infrastructure, and other necessities for internet access to those with the lowest current access. Increasing access from 10% to 20% contributes more to national happiness than from 80% to 90%. Thus, instead of making a large donation to one’s alma mater in the US or even the public school system, the biggest difference will be made by donating that same amount to a school in a country with lower overall access to the internet and overall happiness.
When looking to increase internet access, organizations should consider this 2013 analysis of internet access and use in 11 African countries by Stork, Calandro, and Gillwald. This analysis found that smartphones, when combined with prepaid data plans, are an easy to learn and relatively inexpensive way to address the divide in internet access. A similar analysis in Thailand suggests that mobile internet could be an alternative technology to bridge the digital divide (Srinuan). Rather than relying on wired infrastructure or public access points such as internet cafés, schools, and libraries, it may be fruitful to invest in incentivizing competition for mobile phones and prepaid phone plans in these countries with lower internet access and investigate the effects.
Moving forward, we would like to further research the correlation between education and increased happiness from internet access. We hypothesize that internet access is most closely related to general happiness when accompanied by better education systems. Additionally, we are interested in acquiring qualitative data surrounding quality of life.
More Information
YouTube Video Links
Run Notebook on Google Colab
For a more in-depth analysis and to see our code, please click the link below to run our notebook in Google Colab. No coding is required to run the notebook, you just need to download the “happiness index”, “Book2”, and “merged-data” files above, then run every code cell in order or click Runtime –> Run All.
IO Page
Here is the official github.io website page: https://natschmit.github.io/Quality-of-Life-and-Internet-Access/
Inquiries
For inquiries about this project, please contact Biddy Bi (bix@lafayette.edu),Sam Iacavazzi (iacavazs@lafayette.edu), Shirley Liu (liushi@lafayette.edu), or Natalie Schmit (schmitn@lafayette.edu).
Data Sources
Acknowledgements
- Office of Policy Development & Research, Community Development and the Digital Divide, Fall 2016
- The San Diego Foundation, What is the Digital Divide, September 2020
- Srinuan, C., Srinuan, P., & Bohlin, E. (2012). An analysis of mobile Internet access in Thailand: Implications for bridging the digital divide. Telematics and Informatics, 29(3), 254-262. https://doi.org/10.1016/j.tele.2011.10.003
- Stork, C., Calandro, E., & Gillwad, A. (2013). Internet going mobile: internet access and use in 11 African countries. info, 15(5), 34-51. https://doi.org/10.1108/info-05-2013-0026